Grain Basis Maps
Basis Levels for Soybeans, Corn, Wheat, and Grain Sorghum
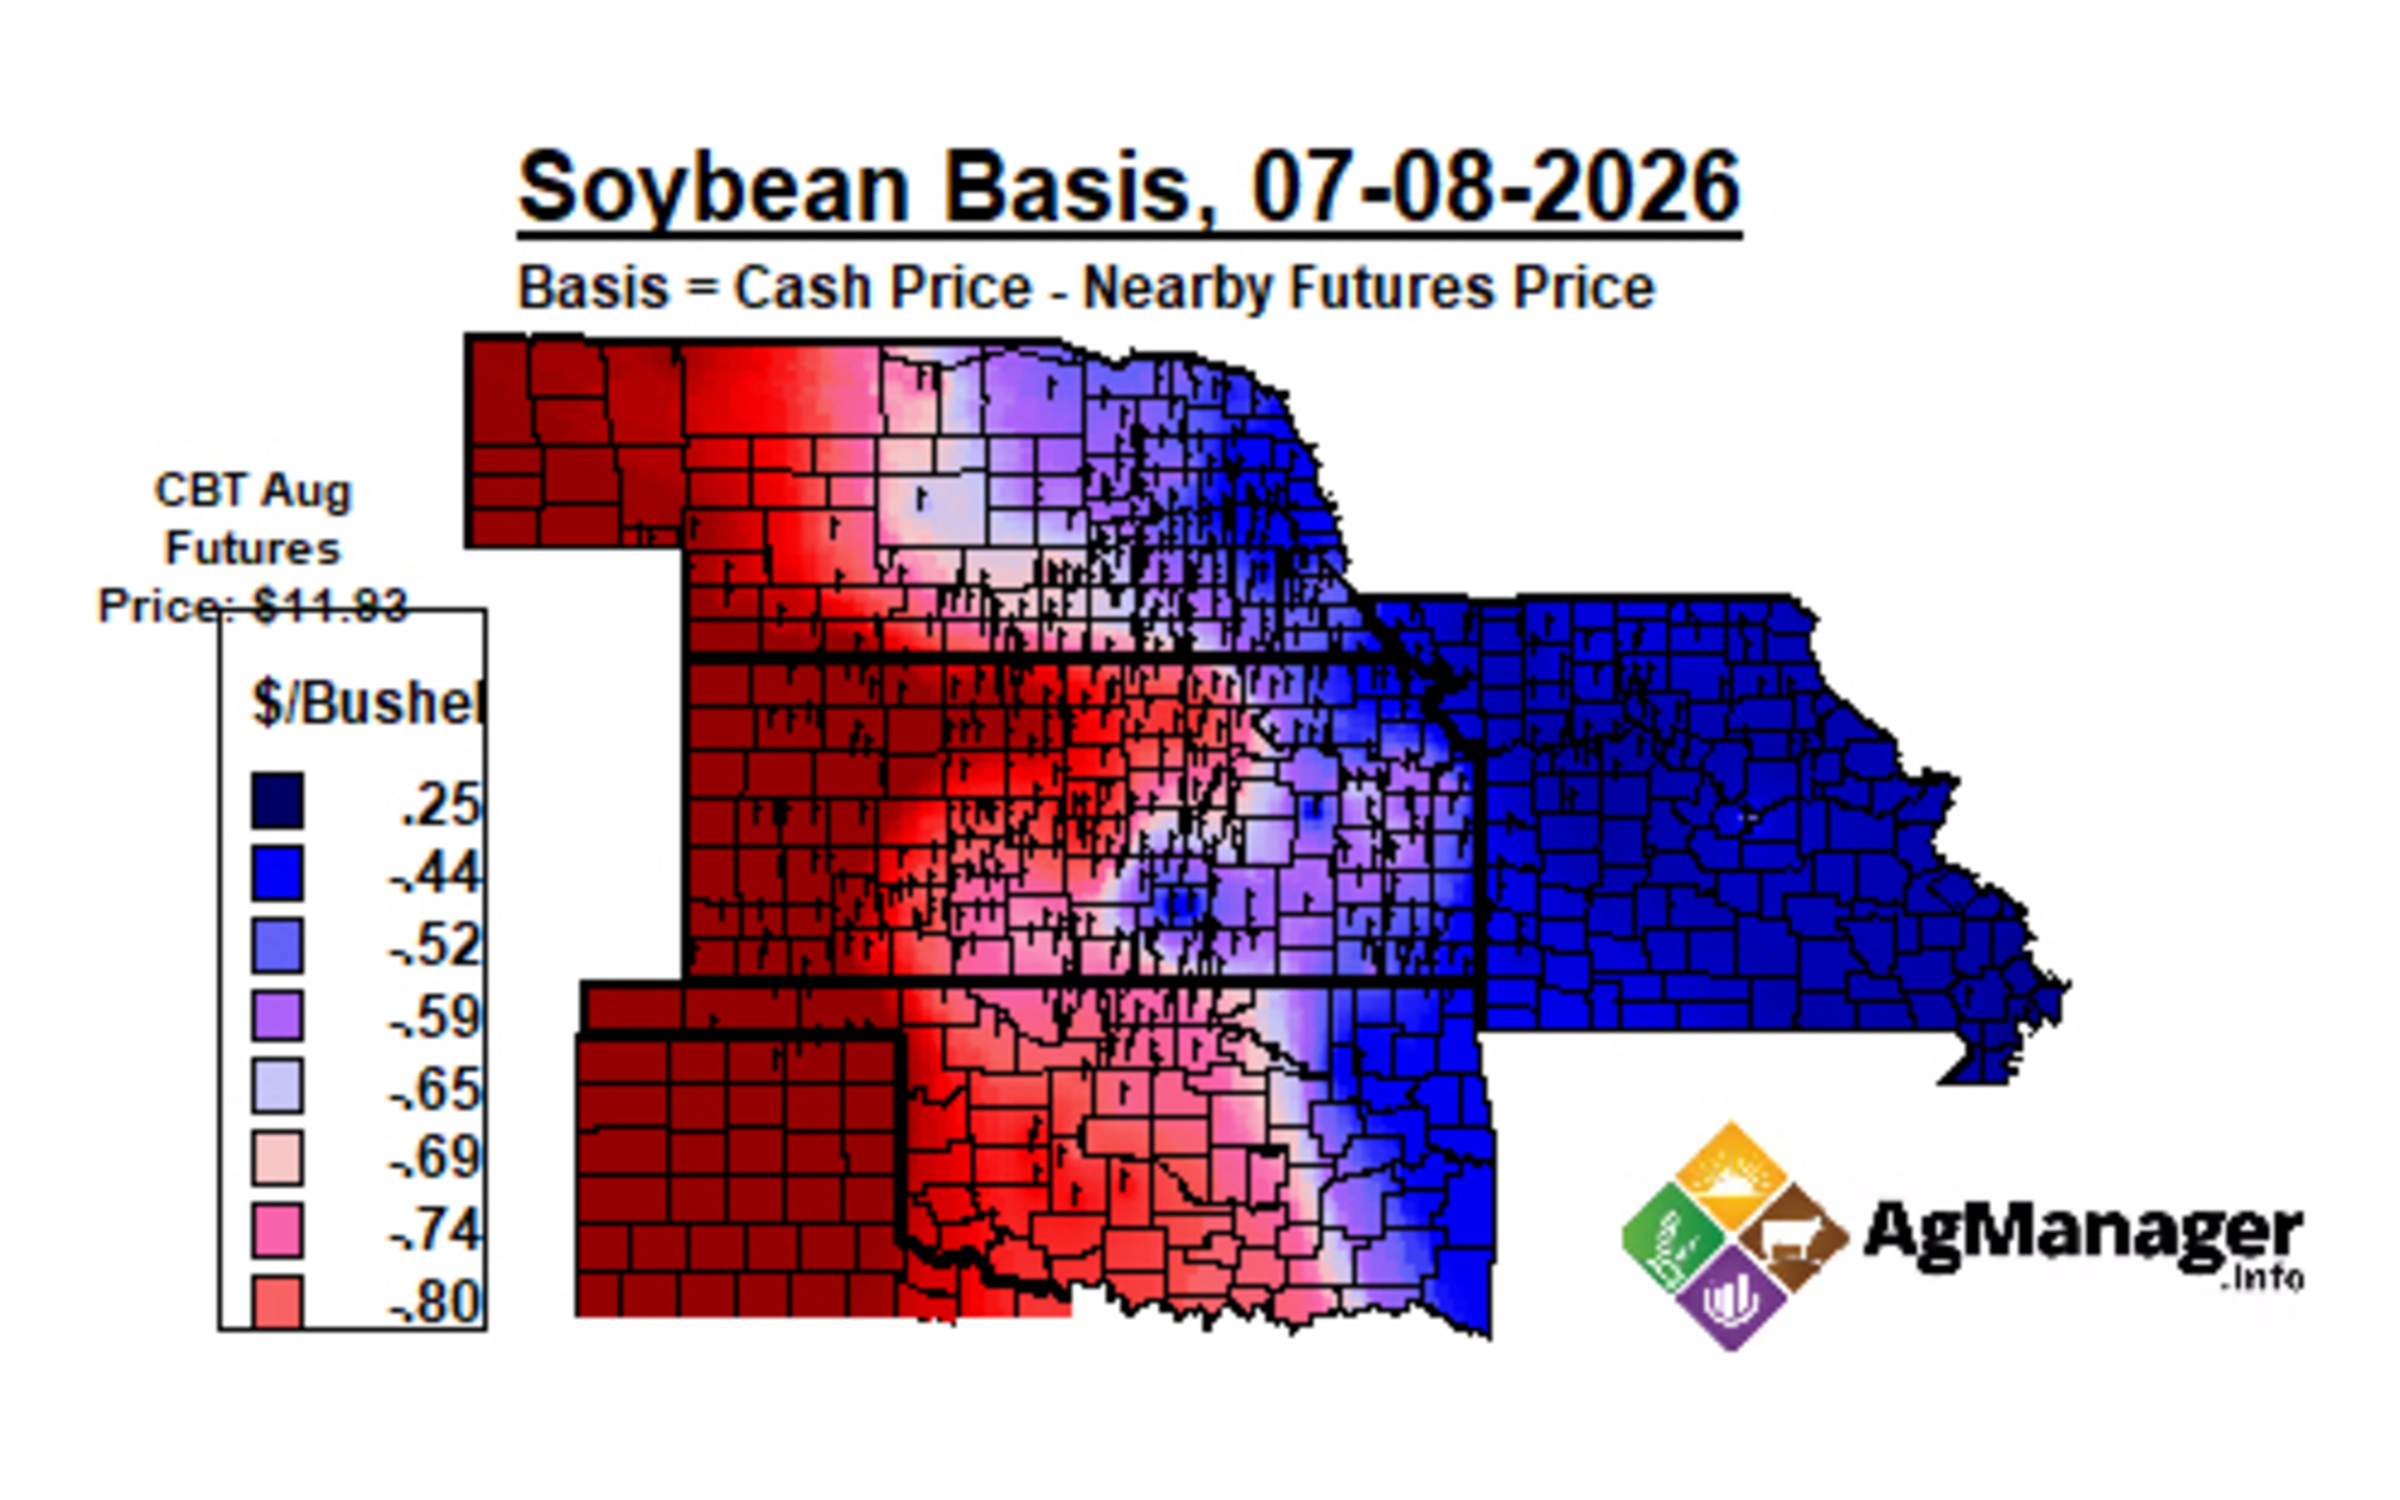
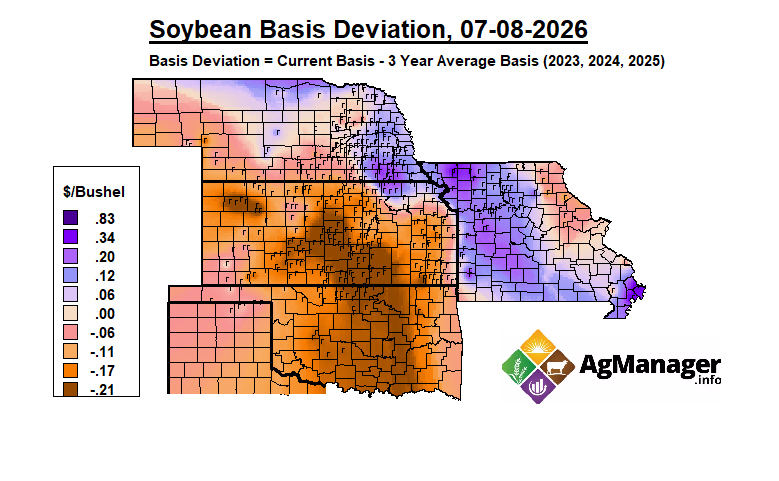
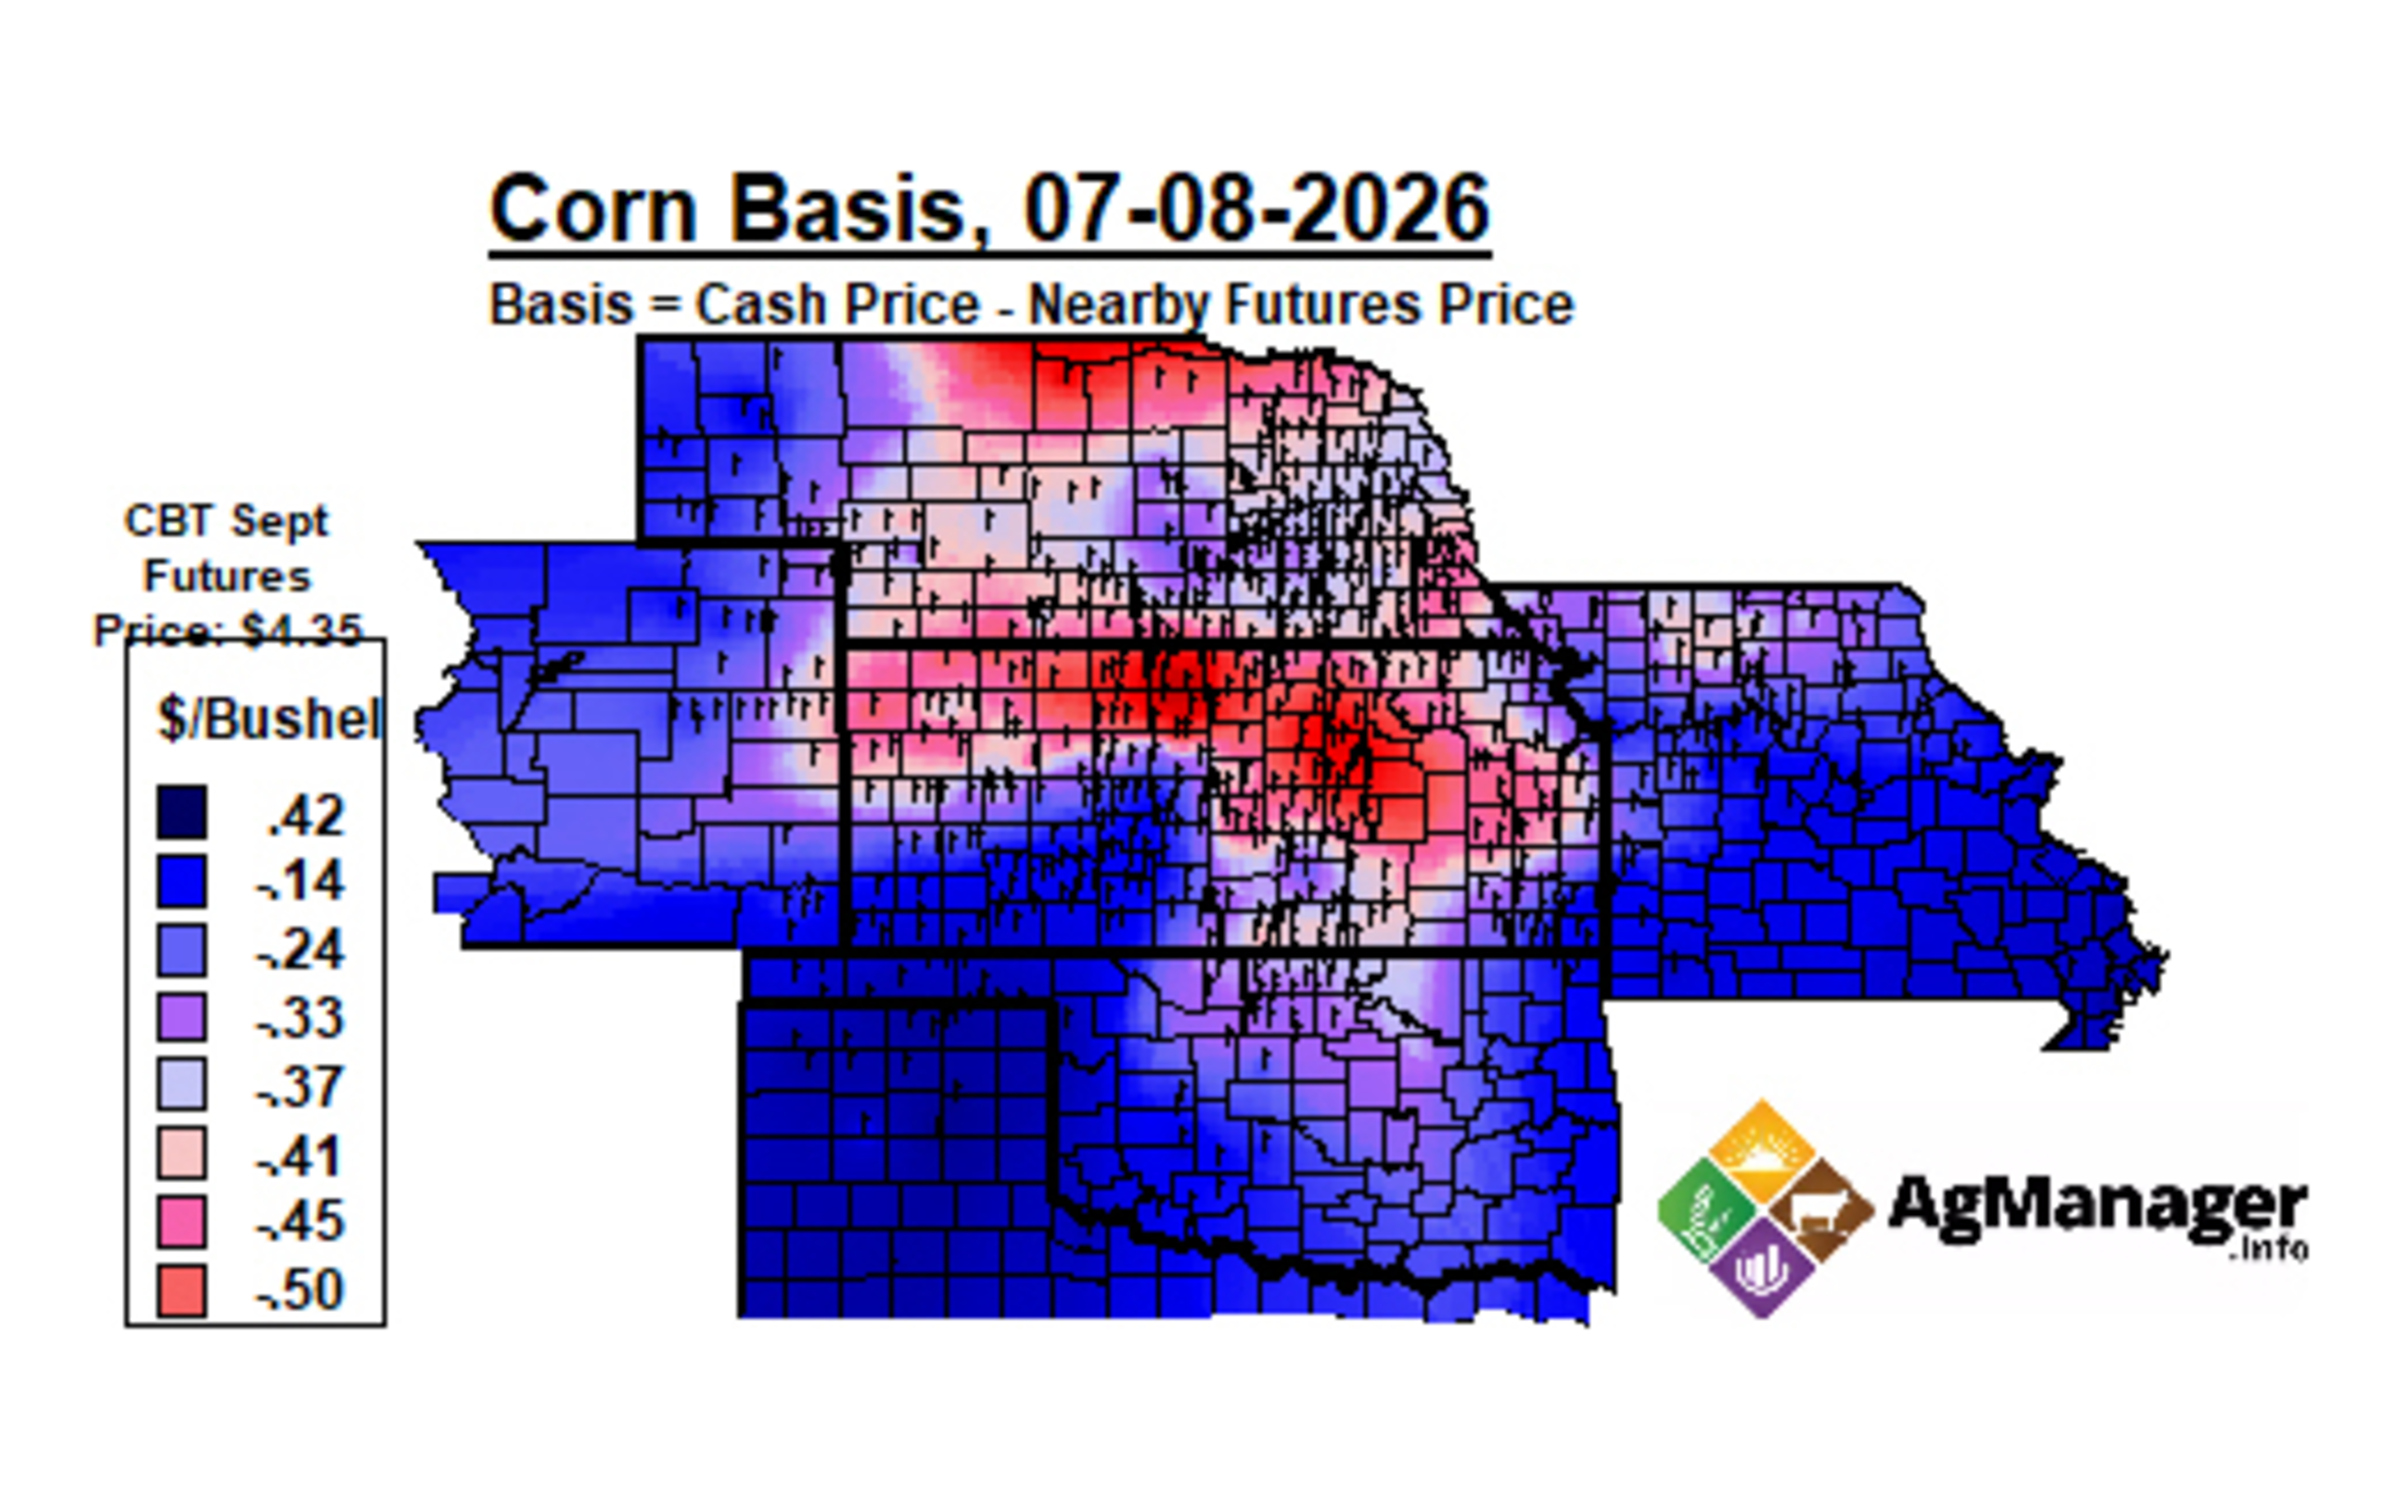
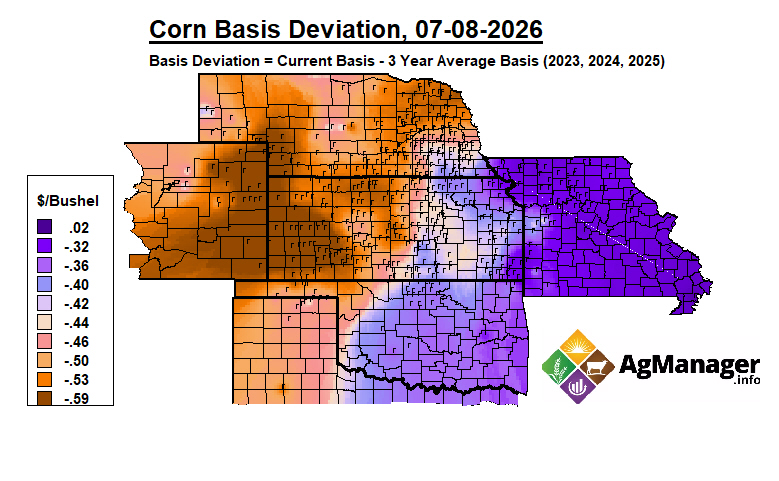
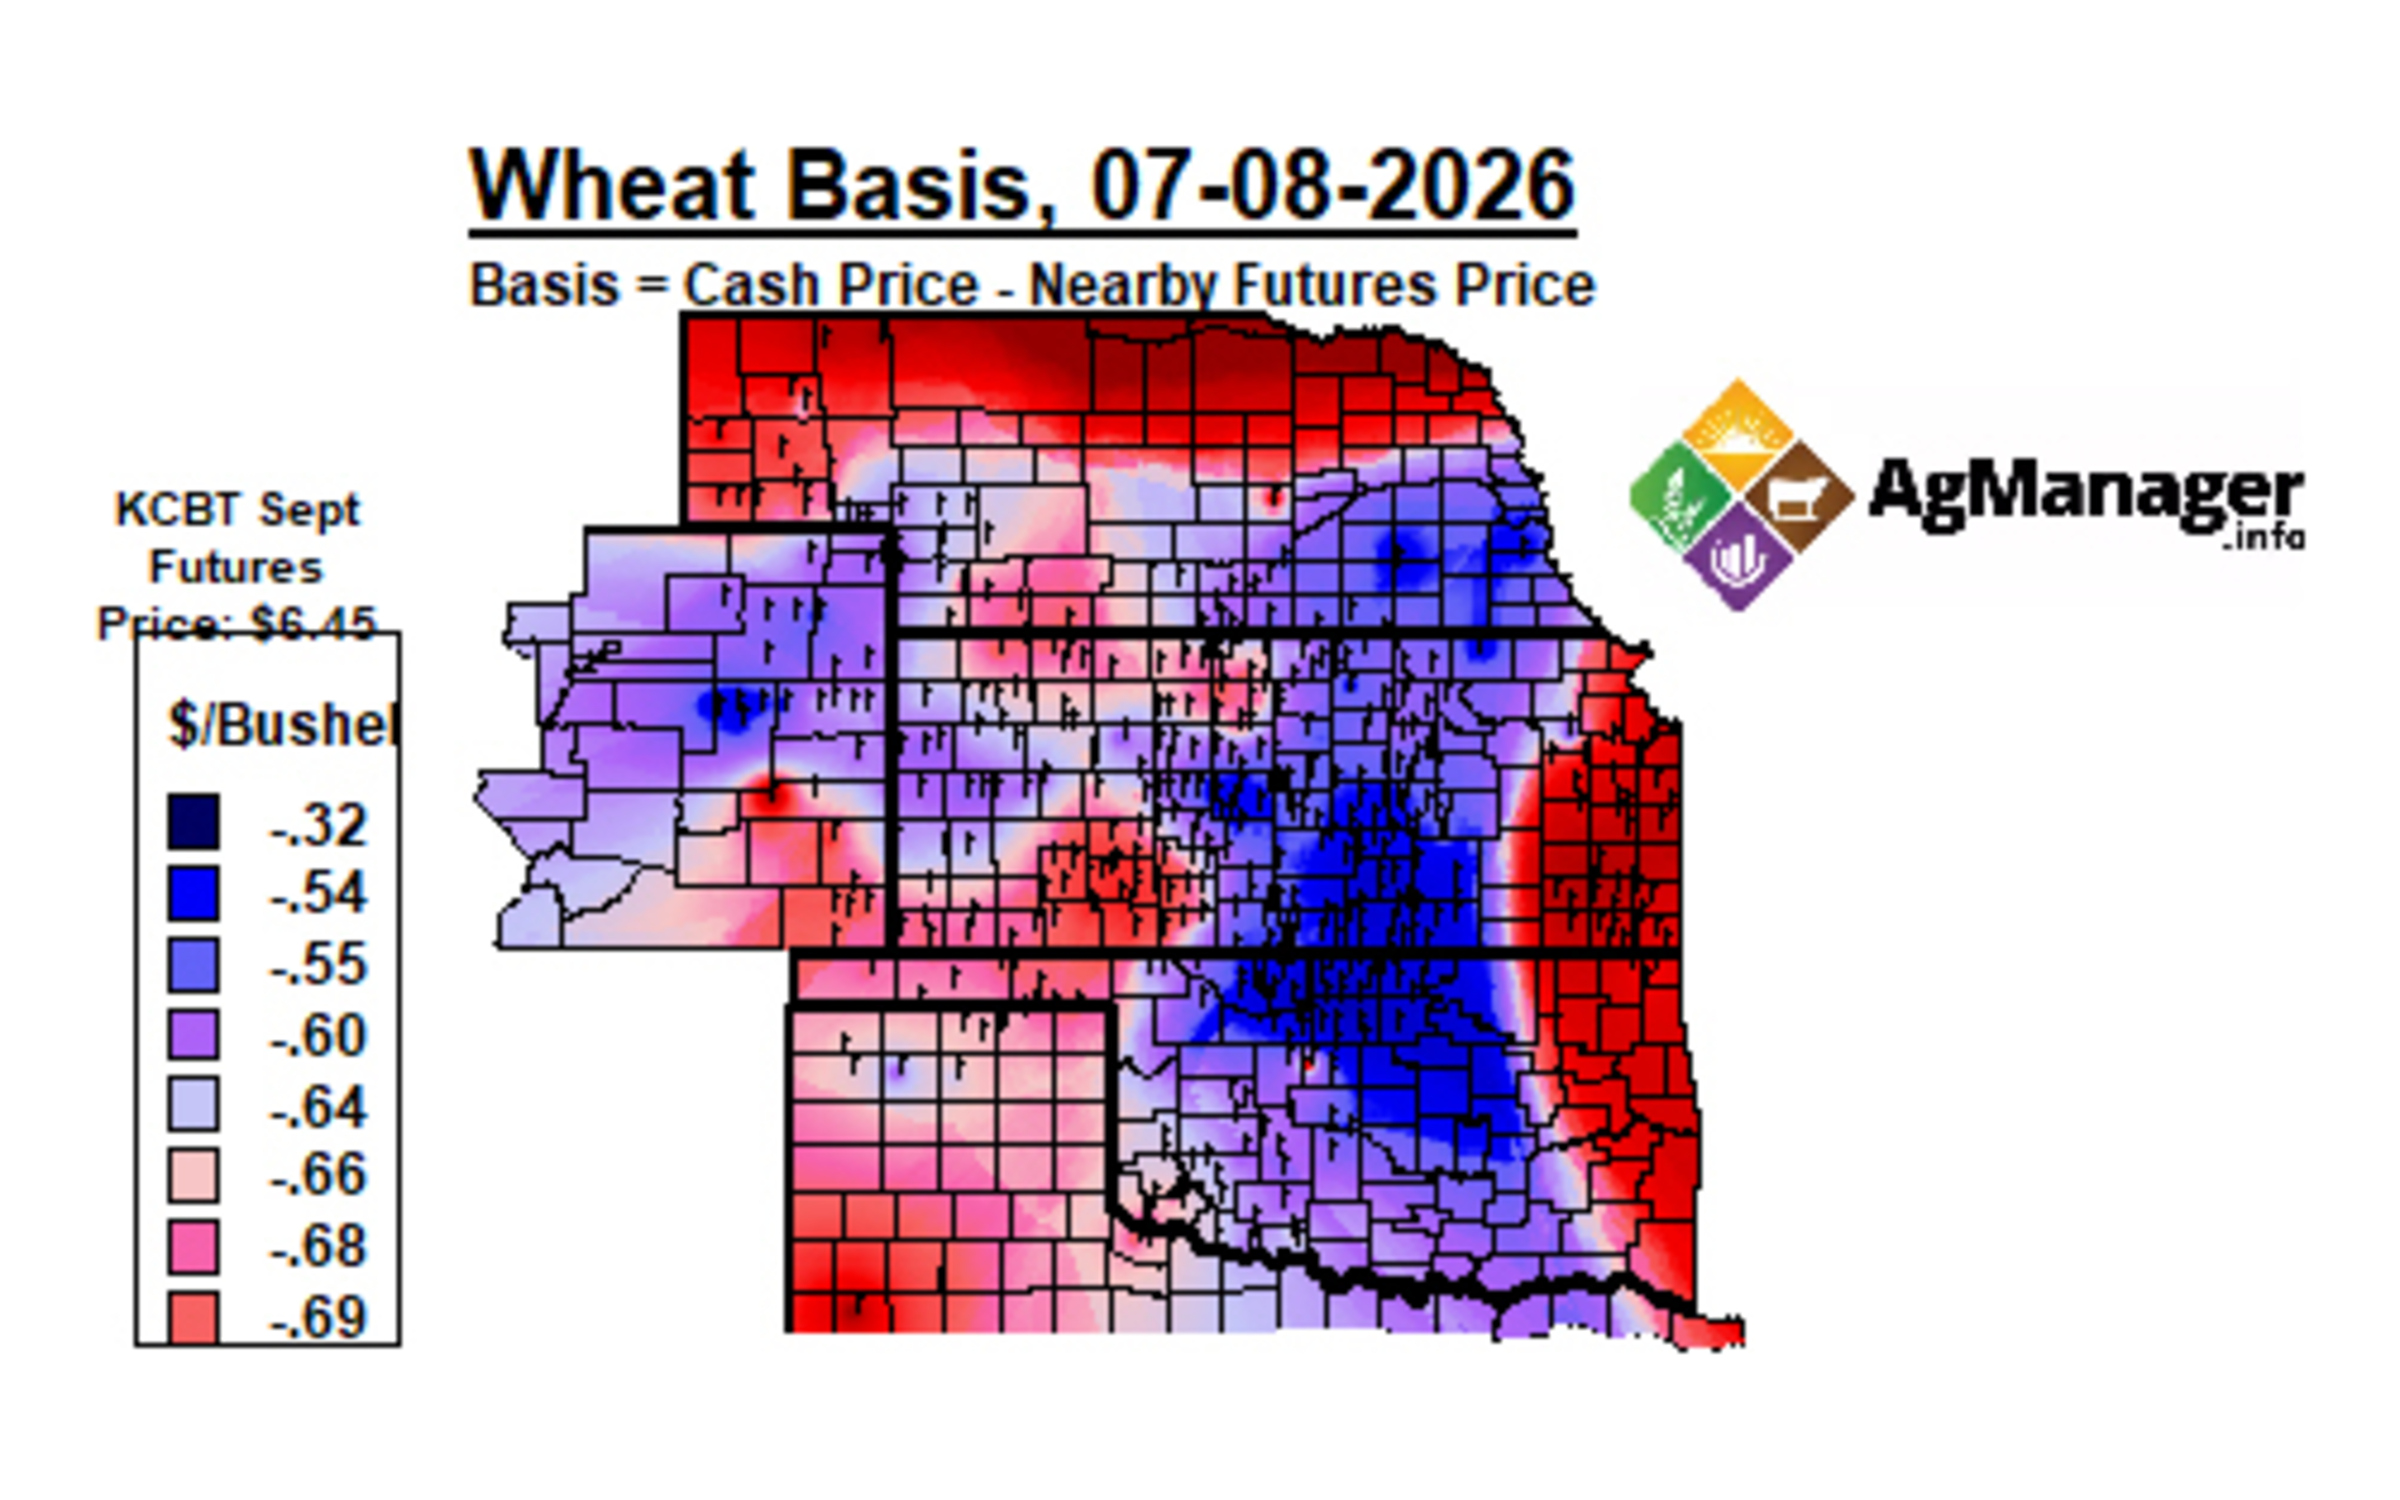
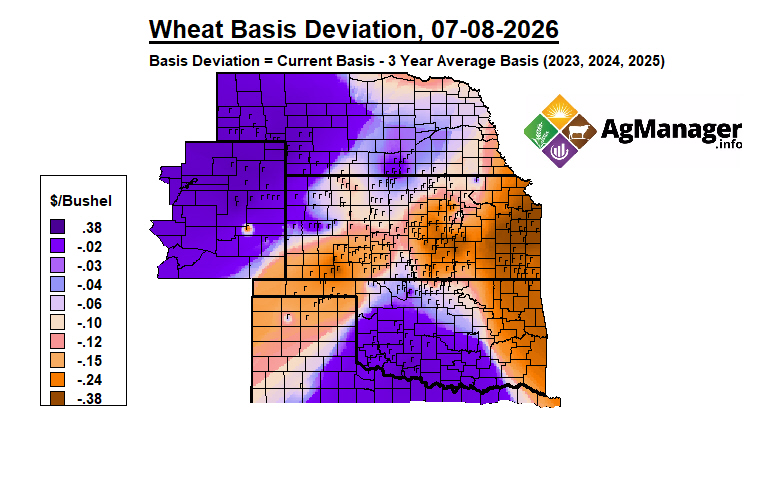
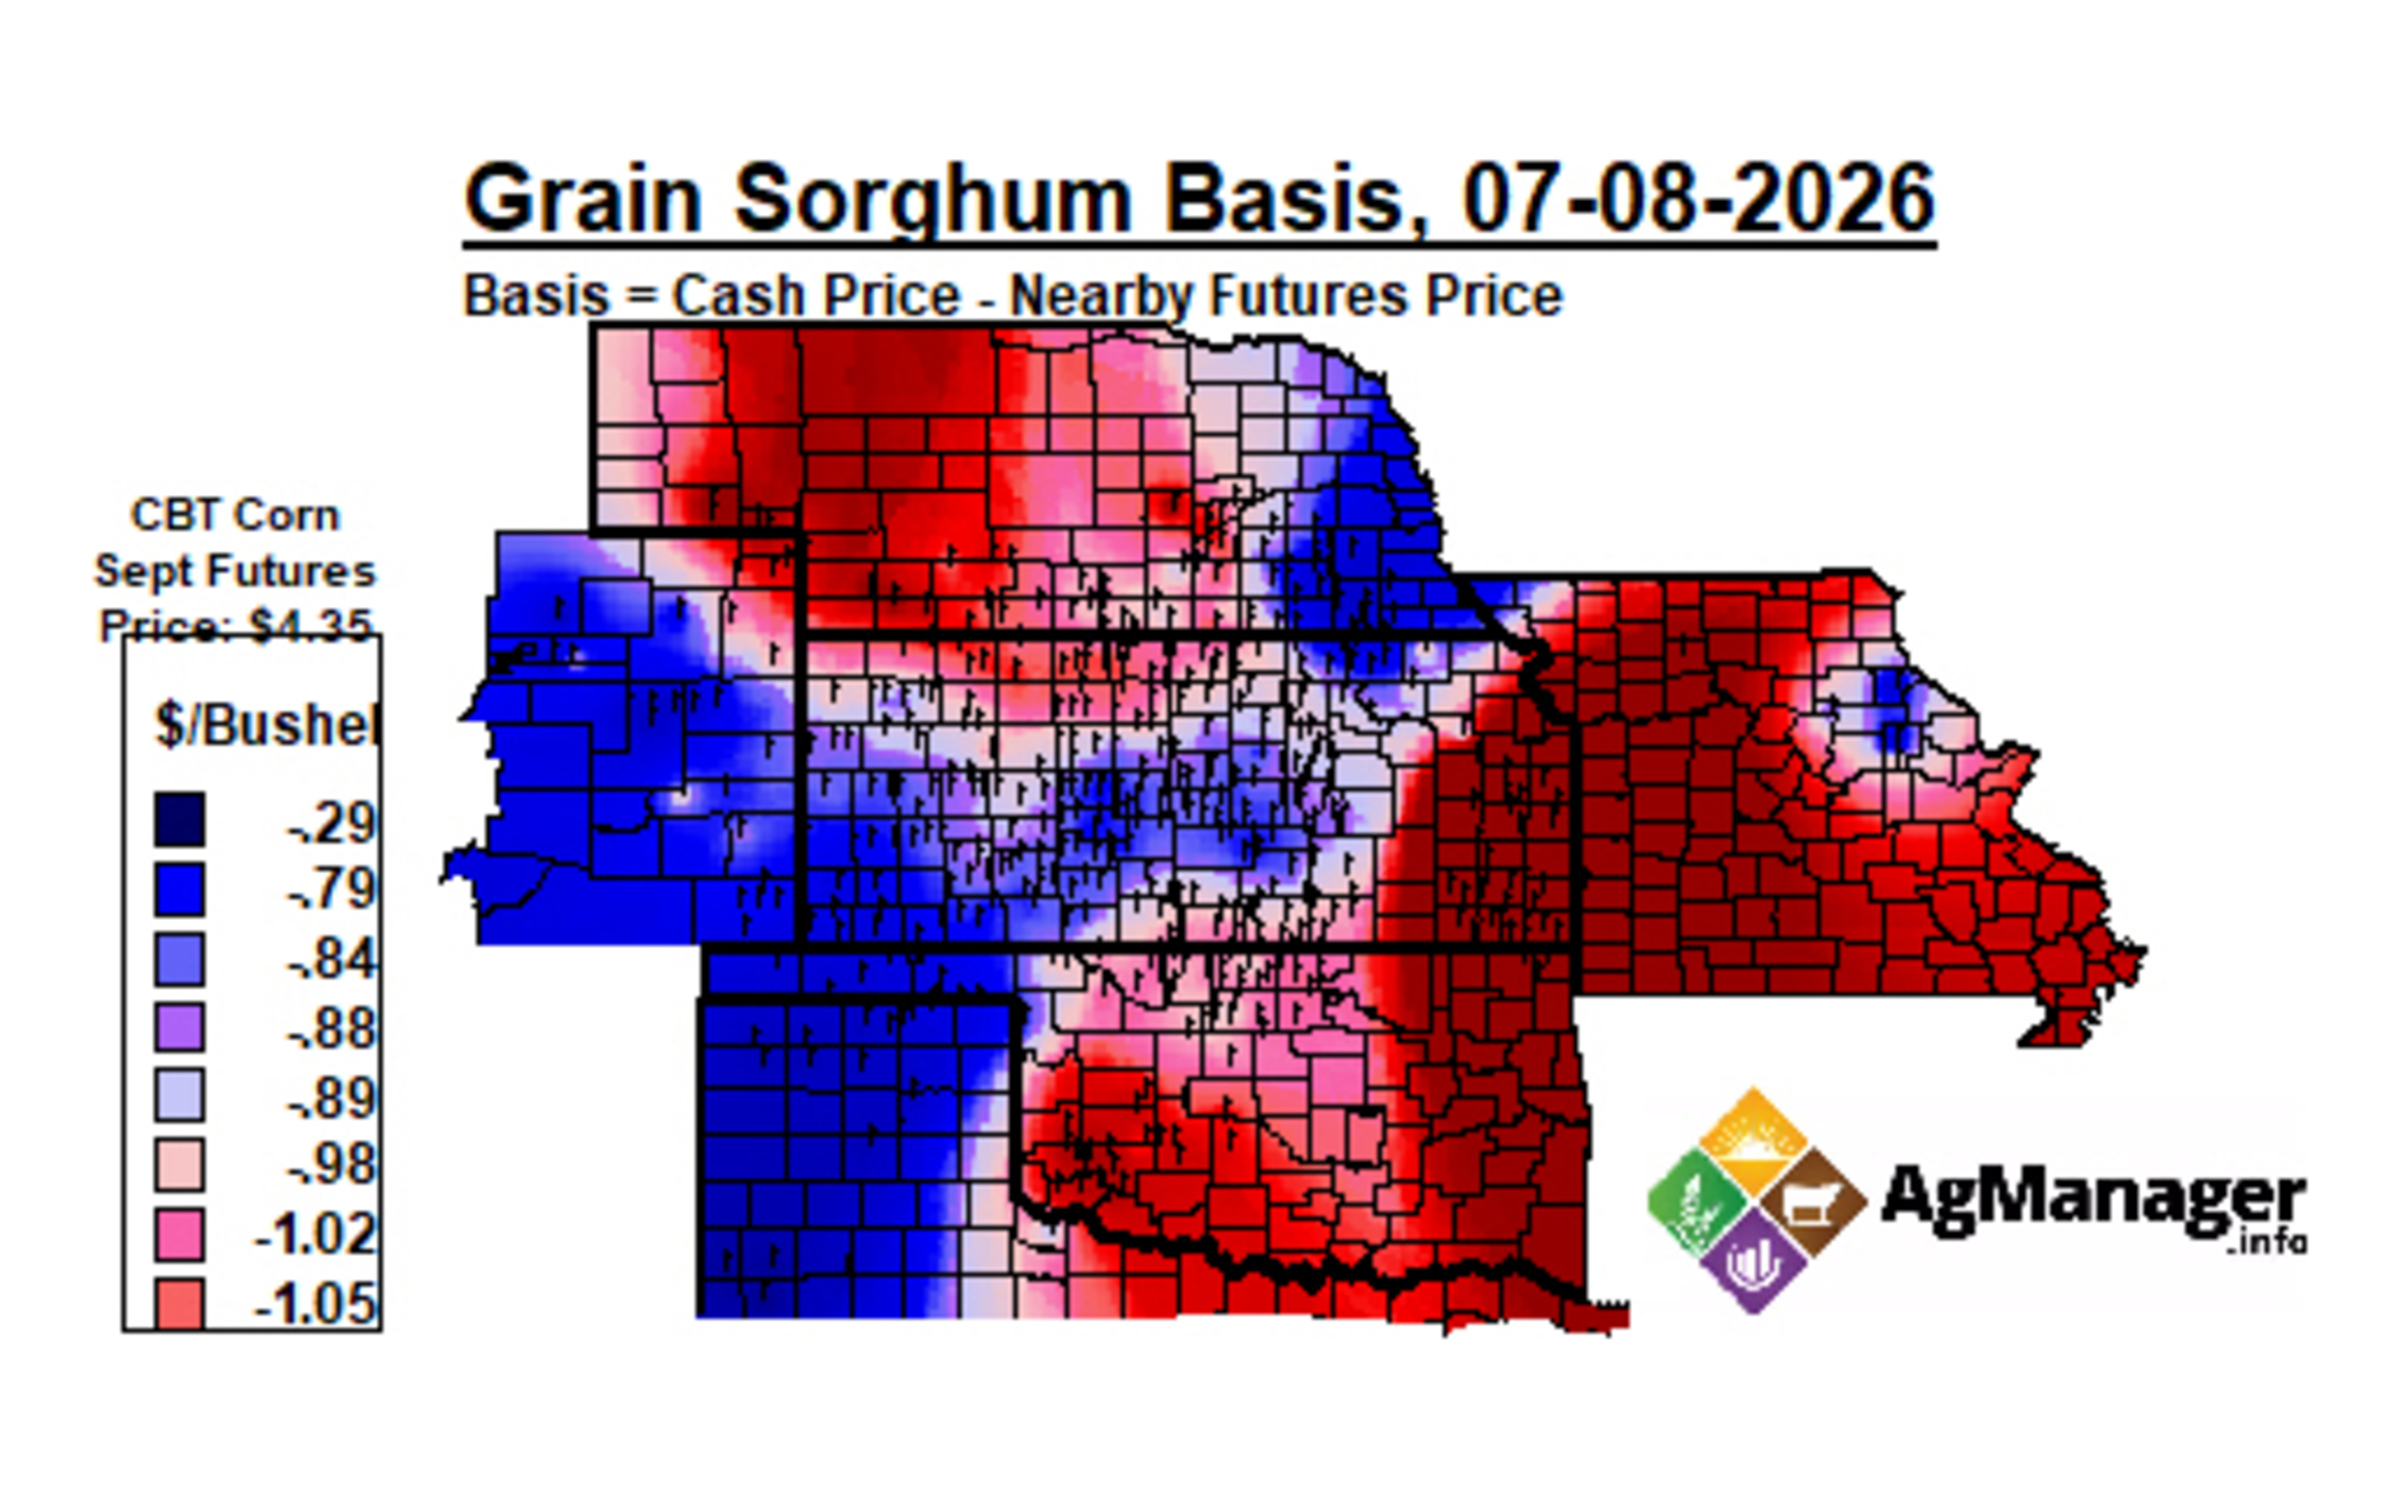
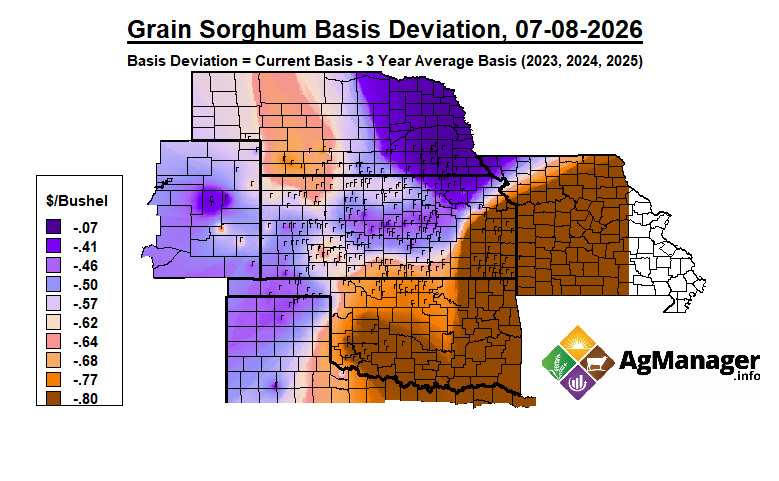
The maps in this report are created from cash and futures prices that are collected and analyzed on each Wednesday of each month. The basis maps in this report show current basis levels for soybeans, corn, wheat, and grain sorghum (grain sorghum basis is calculated using the corn futures market). The basis deviation maps show the difference between the current basis and the three-year historical average basis for the same week and location.
Cash price data were collected for 500-1000 locations, depending on the crop, and the information was analyzed in a Geographic Information System (GIS). Inverse distance methods were used to estimate the change in basis over space, which provides an estimate of the basis for observed and unobserved locations. A flag on the map denotes a location where cash prices were available. Care should be taken in interpreting basis estimates in portions of the Great Plains region where few or no cash prices were available.
Questions? Contact Dr. Rich Llewelyn (rvl@ksu.edu).